Data report · updated November 2026
Tap Water Report 2026: what’s in the tap water of 40 US water systems
These 40 systems serve about 55.8 million people directly and about 74.3 million counting the systems that buy water from them.
Short answer
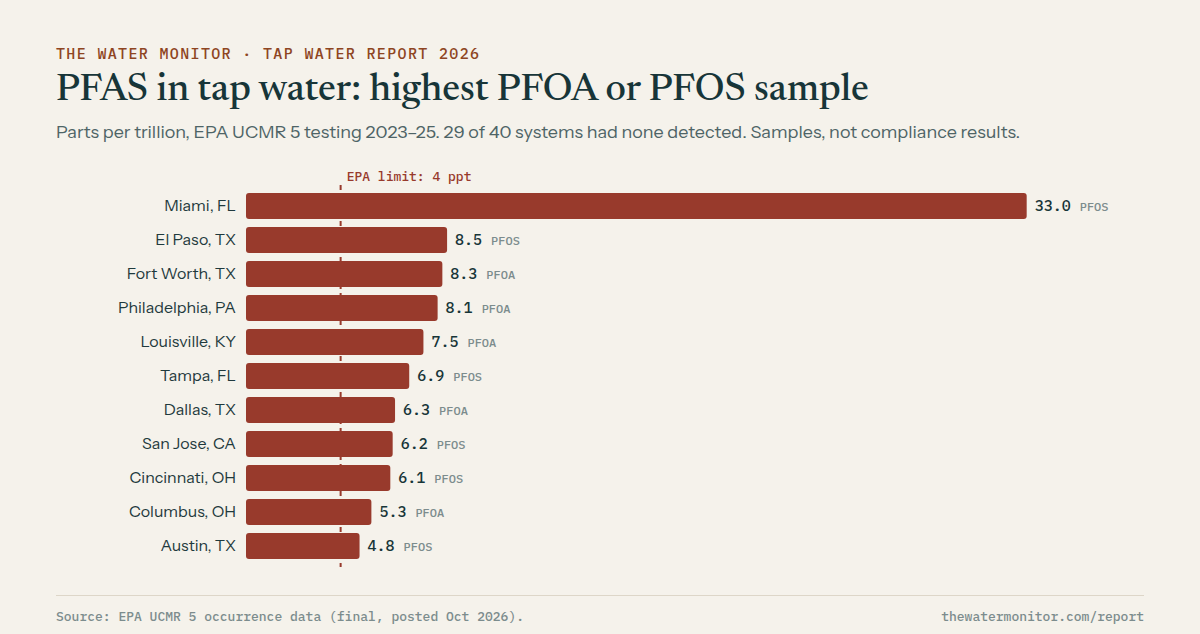
11 of the 40 systems had at least one PFOA or PFOS (two PFAS “forever chemicals”) sample above the U.S. Environmental Protection Agency’s (EPA’s) 4 parts per trillion (ppt) limit in its 2023–25 testing; the highest was Miami, where PFOS reached 33.0 ppt. 11 had lithium above EPA’s 10 micrograms per liter (µg/L) health reference level, led by Phoenix at 160 µg/L. By the utilities’ own reports, 6 have very hard water and 6 have soft water.
EPA UCMR 5 (2023–25), EPA SDWIS 2026Q3, utility water quality reports · Sources and method
01 · Findings
What the numbers show
11of 40
had a PFOA or PFOS sample above EPA’s 4 ppt limit
These are single samples from EPA’s national testing, not violations. Utilities must meet the limit by 2029, judged on a yearly average. In May 2026 EPA proposed giving utilities that request it until 2031; that proposal isn’t final.
11of 40
had lithium above EPA’s 10 µg/L health reference level
- Phoenix160
- El Paso133
- Los Angeles100
- Albuquerque71
- Oklahoma City68
- San Diego65
- Tucson64
- Kansas City59
- Las Vegas43
- Houston34
- San Antonio26
Highest sample in µg/L. Lithium has no legal limit; the reference level is a screening benchmark, and about 24% of large systems nationwide tested above it.
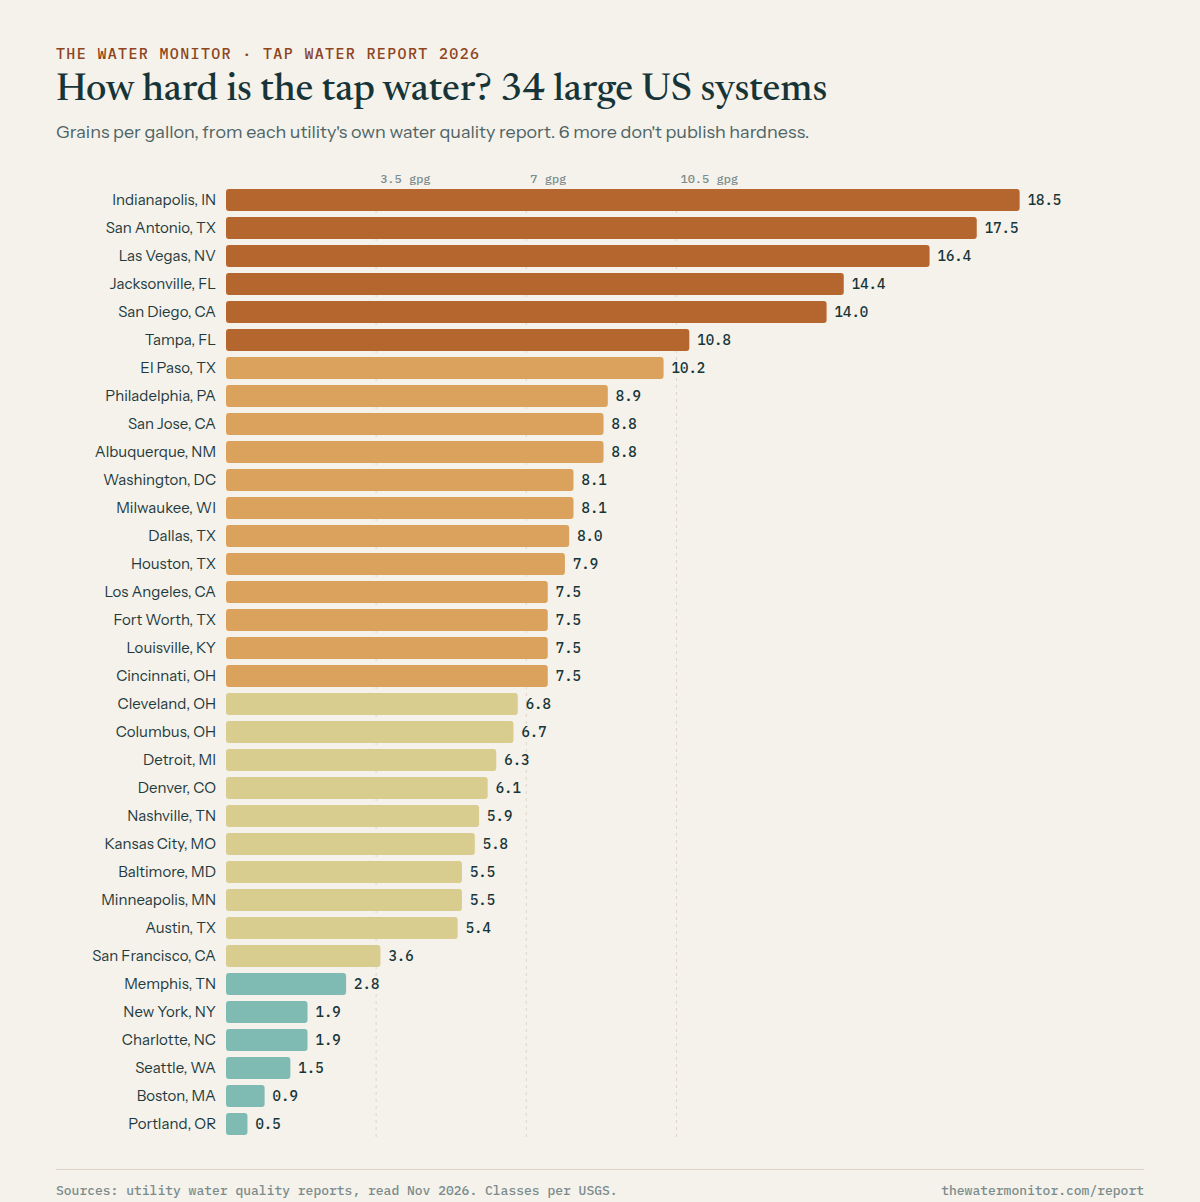
0.5 to 18.5grains per gallon
Hardness runs from Portland, the softest, to Indianapolis, the hardest
Hardness is the reading that decides whether a softener is worth buying. 6 systems have very hard water (over 10.5 grains per gallon) and 6 have soft water.
6of 40
utilities don’t publish hardness in their annual water quality report
Hardness has no federal limit, so the reports don’t have to include it. Homeowners there can ask the utility or test it themselves.
21of 40
use chloramine in all or part of their system
That decides which filter removes the taste: ordinary carbon takes out chlorine quickly but chloramine slowly, so chloramine needs catalytic carbon.
Hardness, by city
0 to 300 mg/L as calcium carbonate
- Indianapolis18.5
- San Antonio17.5
- Las Vegas16.4
- Jacksonville14.4
- San Diego14.0
- Tampa10.8
- El Paso10.2
- Philadelphia8.9
- Albuquerque8.8
- San Jose8.8
- Washington8.1
- Milwaukee8.1
- Dallas8.0
- Houston7.9
- Fort Worth7.5
- Los Angeles7.5
- Louisville7.5
- Cincinnati7.5
- Cleveland6.8
- Columbus6.7
- Detroit6.3
- Denver6.1
- Nashville5.9
- Kansas City5.8
- Baltimore5.5
- Minneapolis5.5
- Austin5.4
- San Francisco3.6
- Memphis2.8
- New York1.9
- Charlotte1.9
- Seattle1.5
- Boston0.9
- Portland0.5
02 · The data
Every system
| City | Hardnessgpg | Hardness class | Disinfectant | PFOA highppt | PFOS highppt | Lithium highµg/L | Health violations5 years |
|---|---|---|---|---|---|---|---|
| Albuquerque, NM | 8.8 | Hard | Free chlorine | none | none | 71 | 0 |
| Atlanta, GA | not published | Free chlorine | none | none | none | 0 | |
| Austin, TX | 5.4 | Moderately hard | Chloramine | none | 4.8 | none | 1 |
| Baltimore, MD | 5.5 | Moderately hard | Free chlorine | none | none | none | 3 |
| Boston, MA | 0.9 | Soft | Chloramine | none | none | none | 0 |
| Charlotte, NC | 1.9 | Soft | Free chlorine | none | none | none | 0 |
| Chicago, IL | not published | Free chlorine | none | none | none | 0 | |
| Cincinnati, OH | 7.5 | Hard | Free chlorine | none | 6.1 | none | 0 |
| Cleveland, OH | 6.8 | Moderately hard | Free chlorine | none | none | none | 0 |
| Columbus, OH | 6.7 | Moderately hard | Free chlorine | 5.3 | none | none | 0 |
| Dallas, TX | 8.0 | Hard | Chloramine | 6.3 | 5.1 | none | 0 |
| Denver, CO | 6.1 | Moderately hard | Chloramine | none | none | 11 | 0 |
| Detroit, MI | 6.3 | Moderately hard | Free chlorine | none | none | none | 0 |
| El Paso, TX | 10.2 | Hard | Free chlorine | none | 8.5 | 133 | 0 |
| Fort Worth, TX | 7.5 | Hard | Chloramine | 8.3 | 7.3 | none | 0 |
| Houston, TX | 7.9 | Hard | Chloramine | none | none | 34 | 1 |
| Indianapolis, IN | 18.5 | Very hard | Chloramine | none | none | none | 0 |
| Jacksonville, FL | 14.4 | Very hard | Free chlorine | none | none | 14 | 0 |
| Kansas City, MO | 5.8 | Moderately hard | Chloramine | none | none | 59 | 0 |
| Las Vegas, NV | 16.4 | Very hard | Free chlorine | none | none | 43 | 0 |
| Los Angeles, CA | 7.5 | Hard | Chloramine | none | none | 100 | 0 |
| Louisville, KY | 7.5 | Hard | Chloramine | 7.5 | none | none | 0 |
| Memphis, TN | 2.8 | Soft | Free chlorine | none | none | none | 0 |
| Miami, FL | not published | Chloramine | 14.0 | 33.0 | none | 0 | |
| Milwaukee, WI | 8.1 | Hard | Chloramine | none | none | none | 0 |
| Minneapolis, MN | 5.5 | Moderately hard | Chloramine | none | none | none | 0 |
| Nashville, TN | 5.9 | Moderately hard | Free chlorine | none | none | none | 0 |
| New York, NY | 1.9 | Soft | Free chlorine | none | none | none | 0 |
| Oklahoma City, OK | not published | Chloramine | none | none | 68 | 0 | |
| Philadelphia, PA | 8.9 | Hard | Chloramine | 8.1 | 6.0 | none | 0 |
| Phoenix, AZ | not published | Free chlorine | none | none | 160 | 0 | |
| Portland, OR | 0.5 | Soft | Chloramine | none | none | none | 0 |
| San Antonio, TX | 17.5 | Very hard | Free chlorine | none | none | 26 | 0 |
| San Diego, CA | 14.0 | Very hard | Chloramine | none | none | 65 | 0 |
| San Francisco, CA | 3.6 | Moderately hard | Chloramine | none | none | none | 0 |
| San Jose, CA | 8.8 | Hard | Chlorine and chloramine | none | 6.2 | 10 | 1 |
| Seattle, WA | 1.5 | Soft | Free chlorine | none | none | none | 0 |
| Tampa, FL | 10.8 | Very hard | Chloramine | 4.6 | 6.9 | none | 0 |
| Tucson, AZ | not published | Free chlorine | none | none | 64 | 0 | |
| Washington, DC | 8.1 | Hard | Chloramine | none | none | none | 0 |
- Red: above EPA’s level. That’s 4 parts per trillion (ppt) for PFOA and PFOS. For lithium it’s 10 micrograms per liter (µg/L), a health reference level rather than a legal limit, which EPA compares at one significant digit, so up to 15 µg/L counts as at the level.
- "None" means not detected. "High" is the highest single sample.
- Sources: hardness from each utility’s published water quality data; PFAS and lithium from EPA’s national testing (UCMR 5), sampled mostly 2023 to 2025; violations from EPA’s federal drinking water database (SDWIS).
03 · Use it
Using this data
The data is free to use under a Creative Commons Attribution license (CC BY 4.0). Please credit "The Water Monitor" and link this page. The CSV has one row per system, with the EPA system ID and the URL of the utility report each hardness figure came from.
Suggested citation: The Water Monitor, "Tap Water Report 2026," thewatermonitor.com/report/, November 2026.
Sources
- 01EPA, Fifth Unregulated Contaminant Monitoring Rule (UCMR 5) occurrence data, file posted 2026-10-15
- 02EPA, Safe Drinking Water Information System via ECHO, 2026Q3 file
- 03EPA, PFAS National Primary Drinking Water Regulation, 89 FR 32532
- 04EPA UCMR 5 Data Summary (July 2026)
- 05Utility water quality reports (one per system, linked on each city page and in the CSV)