Independent tap water research
Know what’s in your tap water before anyone sells you a filter.
City-by-city readings from national testing by the U.S. Environmental Protection Agency (EPA) and each utility’s own report: hardness, PFAS (“forever chemicals”), disinfectant and violations, plus what each one means for softeners and filters. Every number is sourced and dated.
40 water systems · EPA data through September 2026
How hard is the water? 40 large US systems
Dot size: people served
- New York: 1.9 gpg, soft, serving 8.3 million people
- Los Angeles: 7.5 gpg, hard, serving 3.9 million people
- Houston: 7.9 gpg, hard, serving 3 million people
- Chicago: hardness not published by the utility, serving 2.7 million people
- San Antonio: 17.5 gpg, very hard, serving 2.6 million people
- Miami: hardness not published by the utility, serving 2.4 million people
- Phoenix: hardness not published by the utility, serving 1.7 million people
- Philadelphia: 8.9 gpg, hard, serving 1.6 million people
- Baltimore: 5.5 gpg, moderately hard, serving 1.6 million people
- Las Vegas: 16.4 gpg, very hard, serving 1.5 million people
- San Diego: 14.0 gpg, very hard, serving 1.4 million people
- Dallas: 8.0 gpg, hard, serving 1.4 million people
- Columbus: 6.7 gpg, moderately hard, serving 1.3 million people
- Cleveland: 6.8 gpg, moderately hard, serving 1.3 million people
- Denver: 6.1 gpg, moderately hard, serving 1.3 million people
- Charlotte: 1.9 gpg, soft, serving 1.2 million people
- Seattle: 1.5 gpg, soft, serving 1.2 million people
- Austin: 5.4 gpg, moderately hard, serving 1.1 million people
- Atlanta: hardness not published by the utility, serving 1.1 million people
- San Jose: 8.8 gpg, hard, serving 1 million people
- Fort Worth: 7.5 gpg, hard, serving 955,900 people
- Indianapolis: 18.5 gpg, very hard, serving 880,345 people
- San Francisco: 3.6 gpg, moderately hard, serving 848,019 people
- Jacksonville: 14.4 gpg, very hard, serving 826,664 people
- Louisville: 7.5 gpg, hard, serving 806,997 people
- Cincinnati: 7.5 gpg, hard, serving 800,000 people
- Nashville: 5.9 gpg, moderately hard, serving 789,969 people
- El Paso: 10.2 gpg, hard, serving 747,168 people
- Tampa: 10.8 gpg, very hard, serving 733,886 people
- Tucson: hardness not published by the utility, serving 732,906 people
- Boston: 0.9 gpg, soft, serving 675,647 people
- Portland: 0.5 gpg, soft, serving 666,200 people
- Memphis: 2.8 gpg, soft, serving 659,500 people
- Oklahoma City: hardness not published by the utility, serving 644,000 people
- Detroit: 6.3 gpg, moderately hard, serving 633,218 people
- Washington: 8.1 gpg, hard, serving 632,323 people
- Milwaukee: 8.1 gpg, hard, serving 626,000 people
- Albuquerque: 8.8 gpg, hard, serving 560,326 people
- Kansas City: 5.8 gpg, moderately hard, serving 553,295 people
- Minneapolis: 5.5 gpg, moderately hard, serving 425,300 people
Short answer
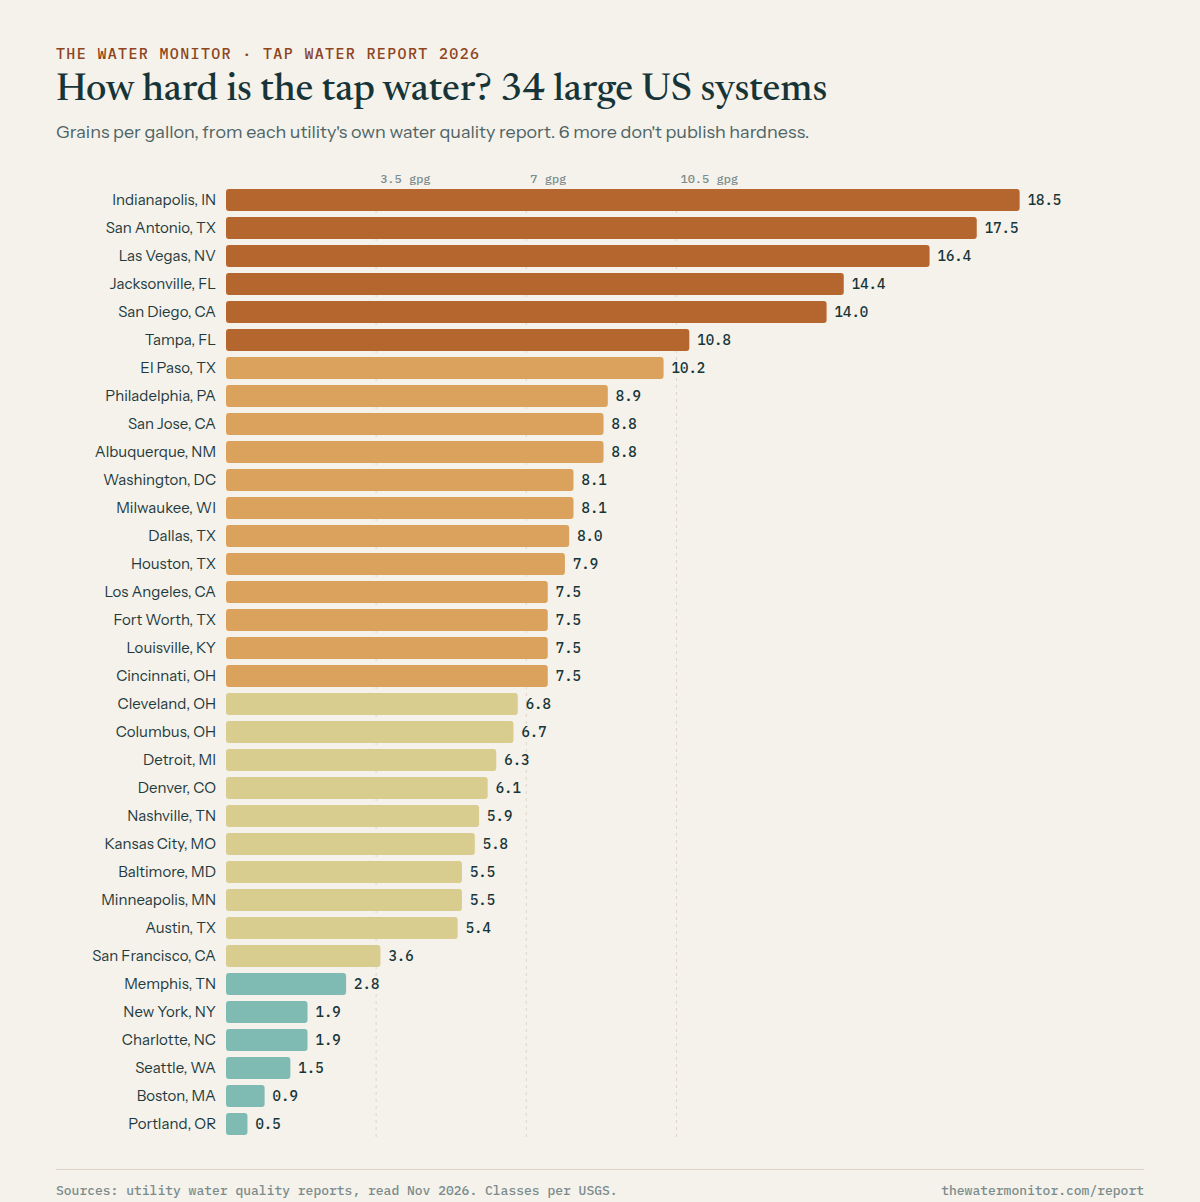
Of the 34 systems we cover whose utilities publish hardness, Indianapolis has the hardest tap water at about 18.5 grains per gallon and Portland the softest at about 0.5. The U.S. Environmental Protection Agency’s (EPA’s) 2023–25 testing found PFOA or PFOS (two PFAS “forever chemicals”) above its 4 parts per trillion (ppt) limit in samples from Miami, Philadelphia, Dallas, Columbus, Austin, San Jose, Fort Worth, Louisville, Cincinnati, El Paso and Tampa. Lithium was above EPA’s health reference level in Los Angeles, Houston, San Antonio, Phoenix, Las Vegas, San Diego, El Paso, Tucson, Oklahoma City, Albuquerque and Kansas City. Hardness decides whether you need a softener; PFAS and disinfectant decide which filter.
EPA UCMR 5 (2023–25 sampling), EPA SDWIS 2026Q3, utility water quality reports · Sources and method
01 · Guides and research
What the readings mean, and what to do about them
Softeners
Filters
Water quality
Testing
Research
02 · Hardness
Every city’s hardness, hardest first
Hardness decides whether a softener is worth buying. Each figure is from the utility’s own report; where it publishes a range, the outline shows it.
Hardness, by city
0 to 300 mg/L as calcium carbonate
- Indianapolis18.5
- San Antonio17.5
- Las Vegas16.4
- Jacksonville14.4
- San Diego14.0
- Tampa10.8
- El Paso10.2
- Philadelphia8.9
- Albuquerque8.8
- San Jose8.8
- Washington8.1
- Milwaukee8.1
- Dallas8.0
- Houston7.9
- Fort Worth7.5
- Los Angeles7.5
- Louisville7.5
- Cincinnati7.5
- Cleveland6.8
- Columbus6.7
- Detroit6.3
- Denver6.1
- Nashville5.9
- Kansas City5.8
- Baltimore5.5
- Minneapolis5.5
- Austin5.4
- San Francisco3.6
- Memphis2.8
- New York1.9
- Charlotte1.9
- Seattle1.5
- Boston0.9
- Portland0.5
03 · The cities
Every city, side by side
One row per water system. Tap a city for its full report: the source, who else drinks the same water, and what fits it.
The 10 largest systems, A to Z.
| City | Hardnessgpg | Hardness class | Disinfectant | PFOA highppt | PFOS highppt | Lithium highµg/L | Health violations5 years |
|---|---|---|---|---|---|---|---|
| Albuquerque, NM | 8.8 | Hard | Free chlorine | none | none | 71 | 0 |
| Atlanta, GA | not published | Free chlorine | none | none | none | 0 | |
| Austin, TX | 5.4 | Moderately hard | Chloramine | none | 4.8 | none | 1 |
| Baltimore, MD | 5.5 | Moderately hard | Free chlorine | none | none | none | 3 |
| Boston, MA | 0.9 | Soft | Chloramine | none | none | none | 0 |
| Charlotte, NC | 1.9 | Soft | Free chlorine | none | none | none | 0 |
| Chicago, IL | not published | Free chlorine | none | none | none | 0 | |
| Cincinnati, OH | 7.5 | Hard | Free chlorine | none | 6.1 | none | 0 |
| Cleveland, OH | 6.8 | Moderately hard | Free chlorine | none | none | none | 0 |
| Columbus, OH | 6.7 | Moderately hard | Free chlorine | 5.3 | none | none | 0 |
| Dallas, TX | 8.0 | Hard | Chloramine | 6.3 | 5.1 | none | 0 |
| Denver, CO | 6.1 | Moderately hard | Chloramine | none | none | 11 | 0 |
| Detroit, MI | 6.3 | Moderately hard | Free chlorine | none | none | none | 0 |
| El Paso, TX | 10.2 | Hard | Free chlorine | none | 8.5 | 133 | 0 |
| Fort Worth, TX | 7.5 | Hard | Chloramine | 8.3 | 7.3 | none | 0 |
| Houston, TX | 7.9 | Hard | Chloramine | none | none | 34 | 1 |
| Indianapolis, IN | 18.5 | Very hard | Chloramine | none | none | none | 0 |
| Jacksonville, FL | 14.4 | Very hard | Free chlorine | none | none | 14 | 0 |
| Kansas City, MO | 5.8 | Moderately hard | Chloramine | none | none | 59 | 0 |
| Las Vegas, NV | 16.4 | Very hard | Free chlorine | none | none | 43 | 0 |
| Los Angeles, CA | 7.5 | Hard | Chloramine | none | none | 100 | 0 |
| Louisville, KY | 7.5 | Hard | Chloramine | 7.5 | none | none | 0 |
| Memphis, TN | 2.8 | Soft | Free chlorine | none | none | none | 0 |
| Miami, FL | not published | Chloramine | 14.0 | 33.0 | none | 0 | |
| Milwaukee, WI | 8.1 | Hard | Chloramine | none | none | none | 0 |
| Minneapolis, MN | 5.5 | Moderately hard | Chloramine | none | none | none | 0 |
| Nashville, TN | 5.9 | Moderately hard | Free chlorine | none | none | none | 0 |
| New York, NY | 1.9 | Soft | Free chlorine | none | none | none | 0 |
| Oklahoma City, OK | not published | Chloramine | none | none | 68 | 0 | |
| Philadelphia, PA | 8.9 | Hard | Chloramine | 8.1 | 6.0 | none | 0 |
| Phoenix, AZ | not published | Free chlorine | none | none | 160 | 0 | |
| Portland, OR | 0.5 | Soft | Chloramine | none | none | none | 0 |
| San Antonio, TX | 17.5 | Very hard | Free chlorine | none | none | 26 | 0 |
| San Diego, CA | 14.0 | Very hard | Chloramine | none | none | 65 | 0 |
| San Francisco, CA | 3.6 | Moderately hard | Chloramine | none | none | none | 0 |
| San Jose, CA | 8.8 | Hard | Chlorine and chloramine | none | 6.2 | 10 | 1 |
| Seattle, WA | 1.5 | Soft | Free chlorine | none | none | none | 0 |
| Tampa, FL | 10.8 | Very hard | Chloramine | 4.6 | 6.9 | none | 0 |
| Tucson, AZ | not published | Free chlorine | none | none | 64 | 0 | |
| Washington, DC | 8.1 | Hard | Chloramine | none | none | none | 0 |
- Red: above EPA’s level. That’s 4 parts per trillion (ppt) for PFOA and PFOS. For lithium it’s 10 micrograms per liter (µg/L), a health reference level rather than a legal limit, which EPA compares at one significant digit, so up to 15 µg/L counts as at the level.
- "None" means not detected. "High" is the highest single sample.
- Sources: hardness from each utility’s published water quality data; PFAS and lithium from EPA’s national testing (UCMR 5), sampled mostly 2023 to 2025; violations from EPA’s federal drinking water database (SDWIS).
04 · Where the numbers come from
Read from the source, not repeated
PFAS and lithium readings come from EPA’s fifth Unregulated Contaminant Monitoring Rule, the agency’s national sampling of every large water system from 2023 to 2025. Violations and who buys water from whom come from EPA’s federal drinking water database.
Hardness isn’t in any reliable national file, so we read it from each utility’s own published data, usually its annual water quality report, and cite the document, the year and the day we read it. When a utility publishes a range, we show the range.
How we build every page →